The AWS Shared Responsibility Model: 3 Areas of Improvement to Make Today Part 3: Logging, Monitoring, and Alerting in AWS

In the last two parts of this series, we discussed the AWS Shared Responsibility Model. We started with keeping your private keys private and then moved onto wise use of network infrastructure. In this post, we’ll discuss what happens when something goes wrong. What capabilities does AWS give you to monitor your environment? And how can you use them effectively to deliver high-value alerts to your analysts?
Logging capabilities of AWS
Before discussing what specific steps you can take to most effectively monitor your cloud environment, let’s take a look at what services AWS has to offer customers.
If you’re in a highly regulated environment and compliance is key for you, AWS CloudTrail is a service you should know. CloudTrail records all actions taken by users, roles, and services within your AWS environment. You can use it to monitor actions taken via the AWS Management Console and Command Line Interface (CLI), along with any AWS code libraries.
CloudTrail stores all events from a single account for 90 days. You can also configure CloudTrail to archive events for later analysis. Later in this post, we’ll see how CloudTrail logs can be sent to downstream processes for reporting and monitoring functions.
VPC Flow Logs offer visibility into the network traffic coming into and going out of a Virtual Private Cloud (VPC). These logs allow for quick troubleshooting of network problems, such as packets being dropped by overly restrictive security group configurations. You can also use VPC Flow Logs to look for anomalous network traffic which may indicate an intruder within your network.
Amazon CloudWatch is the versatile and flexible cog in the AWS family of logging services. CloudWatch collects logs from several different sources and gathers them into one location for storage and analysis. CloudWatch can gather logs from individual EC2 instances, CloudTrail logs, Route 53 (DNS) logs, and much more. CloudWatch is your best friend when it comes to logging and monitoring in AWS, as many other logging solutions can send their logs to CloudWatch. CloudWatch also enables alerts on certain events where action is required right away. We’ll see how to use CloudWatch to maximize your monitoring within AWS shortly.
AWS has no shortage of tools to help keep your network safe from intruders. But how do you use them effectively?
Best Practices of Logging, Monitoring, and Alerting in AWS
If the amount of logging options seems overwhelming, taking a look at established best practices will help you decide what is best for your organization.
CloudTrail logs should be enabled in all regions. This allows you to monitor calls to unused regions to make sure no one is trying to use services in the places you’re not looking. You should also enable log file validation. Validation ensures the integrity of your log files, which is invaluable in forensics investigations. By default, CloudTrail stores your logs in S3 and encrypts them using S3 Server-side Encryption. If you choose, you can change this to use Key Management Services (KMS) instead. It’s also a good idea to send your CloudTrail logs to CloudWatch, which we’ll explore in more detail later.
VPC Flow Logs can be configured to monitor each network interface, a particular subnet, or an entire VPC. The logs are sent to CloudWatch, where you can filter and analyze the data. You can choose to log all traffic, traffic which is accepted into the VPC, or traffic which is rejected. Make sure to know what you will need and actually use, so you’re not taking up huge amounts of space or creating noise for your analysts. Log what is most important for your specific needs.
Centralized Logging in AWS
Centralizing your log management is the best use of AWS logging services. Centralization allows you to monitor multiple services in multiple regions in one convenient place. Then alerts can be created based on anomalous behavior and quick action can be taken.
Several AWS services can be brought together in a centralized log management strategy. First, it’s important to understand your requirements. What are your business and compliance requirements? How long are logs to be retained? What is the log lifecycle and when can they be moved to more cost-efficient storage like Amazon Glacier?
When the requirements are completed, work can begin on the actual centralization architecture. Amazon has a recommended architecture for centralized logging. We’ll explore the key pieces of that implementation.
The first step is to take your CloudTrail logs and send them to CloudWatch. VPC Flow Logs automatically are sent to CloudWatch. CloudWatch also has logs from individual EC2 instances such as web and application servers.
Next, a Lambda function loads log data from CloudWatch into an ElasticSearch Service (ES) domain. ES is an Amazon service for deploying, securing, operating, and scaling the popular ElasticSearch data analysis tool. You can use ES to analyze the large amounts of log data flooding into CloudWatch. ES has built-in integrations with Kibana for easy creation of dashboards.
The front-end of the architecture sports a load-balancer which sits in front of proxy servers which have security groups restricting IP addresses which can connect to the ES domain. A Kibana client connects through the proxies to ES, allowing an end user to quickly search and create dashboards based on the CloudWatch data.
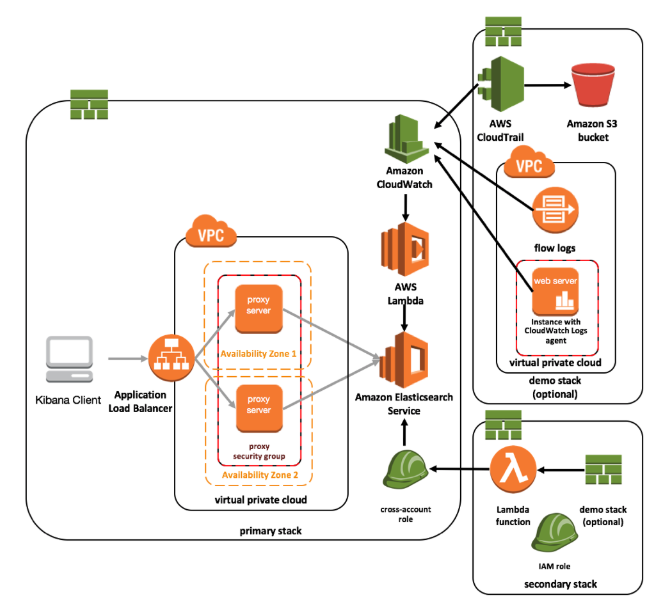
In a nutshell, here’s what AWS suggests:
-
EC2, VPC Flow Logs, and CloudTrail logs are send to CloudWatch
-
A custom Lambda function loads data from CloudWatch into ElasticSearch Service.
-
ElasticSearch Service provides searching and analysis functions for the log data
-
The analysis is served through a Kibana dashboard client, with a set of proxy servers in front of ES for basic authentication.
The implementation guide can help you build this yourself and has CloudFormation Templates you can use to deploy it in your environment. Data visualization capabilities of Kibana will allow you to quickly point out anomalies which should be investigated by analysts.
Protect Your House
You wouldn’t leave your house open for anyone to enter and potentially hurt your family. You hide your keys and make sure only those you trust have them. You install door locks and window locks so only those authorized are allowed in. You have a security and monitoring system in place in case the initial protections fail in some way.
You AWS environment is no different. You protect sensitive credentials and encryption keys, making sure only those you trust can use them. You configure VPCs, network ACLs, and security groups to keep out unwanted traffic. If these fail in some way, you have a centralized logging and monitoring system in place to quickly alert you to intruders so you can act.
One of the best ways to test your implementation is by leveraging the power of hacker-powered security and ask talented and trusted hackers to see what they can break and report it to you for quick resolution. Get in touch with us to learn more about how we can help you secure your AWS environment, just like we’ve helped SumoLogic.
HackerOne is the #1 hacker-powered security platform, helping organizations find and fix critical vulnerabilities before they can be criminally exploited. As the contemporary alternative to traditional penetration testing, our bug bounty program solutions encompass vulnerability assessment, crowdsourced testing and responsible disclosure management. Discover more about our security testing solutions or Contact Us today.