Quantify and communicate your security program’s impact
Powered by the world’s largest dataset of vulnerabilities, Hackerone helps you analyze trends, measure financial impact, and communicate results with dashboards designed for CISOs, boards, and program managers alike.

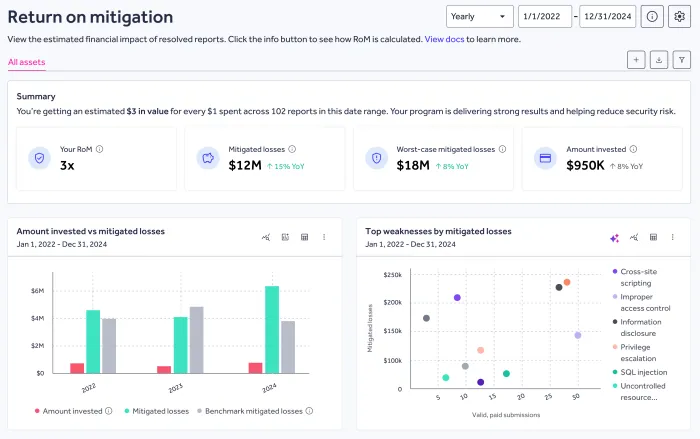
Return on Mitigation Dashboard
The RoM Dashboard gives you a live, continuously updated view of your mitigated losses and RoM performance over time. It’s built for leaders who need defensible, board-ready metrics, not just raw data.
- Track RoM and mitigated losses year over year to show progress and trends.
- Export polished summaries for boards, CFOs, compliance reporting, and cyber insurance submissions.
- Compare results across your HackerOne programs to make smarter investment decisions.
- Tailor inputs like industry, revenue, breach impact, and incident rate to align results with your organization’s risk model.
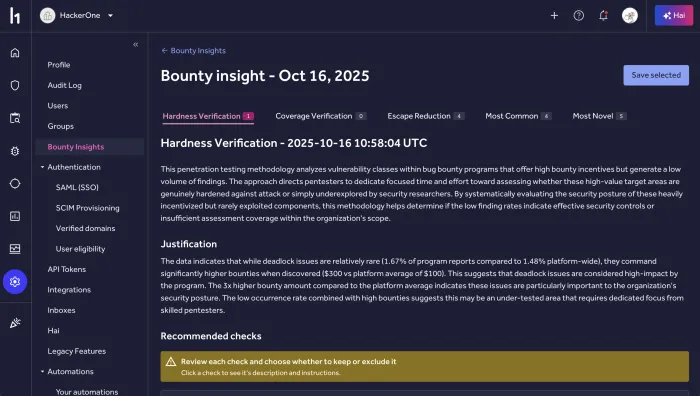
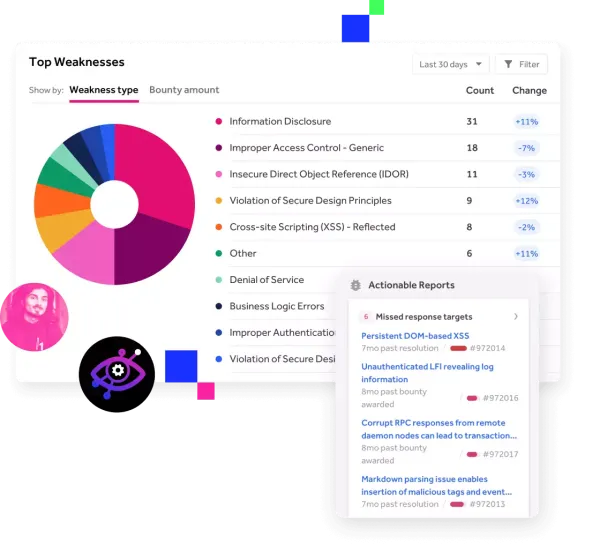
Bounty Insights
Turn your validated bounty findings into actionable intelligence that strengthens your security strategy, guides your next test, and drives continuous improvement.
- Expose recurring patterns to uncover systemic weaknesses and reduce repeat vulnerabilities.
- Pinpoint your highest-risk apps and environments using real-world exploit data.
- Inform future testing scopes with insights proven by actual bounty activity.
- Measure your security program’s effectiveness and whether efforts are strengthening your overall security posture.
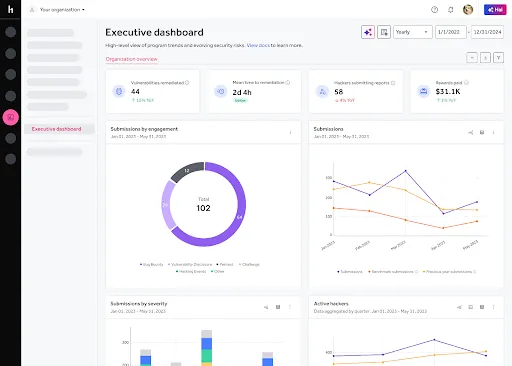
Executive Dashboard
The Executive Dashboard turns your program data into clear, actionable reports designed for CISOs, boards, and security teams. It consolidates critical metrics so you can measure performance, identify gaps, and communicate results without manual reporting.
- Track critical metrics over time, including vulnerabilities remediated, mean time to remediation (MTTR), active hacker engagement, and rewards paid, all with year-over-year comparisons.
- Segment submissions by engagement type to understand coverage and program mix.
- Benchmark against peers by industry, company size, and asset type to put your performance in context.
- Export ready-to-use visuals for board presentations, quarterly business reviews, and budget discussions.
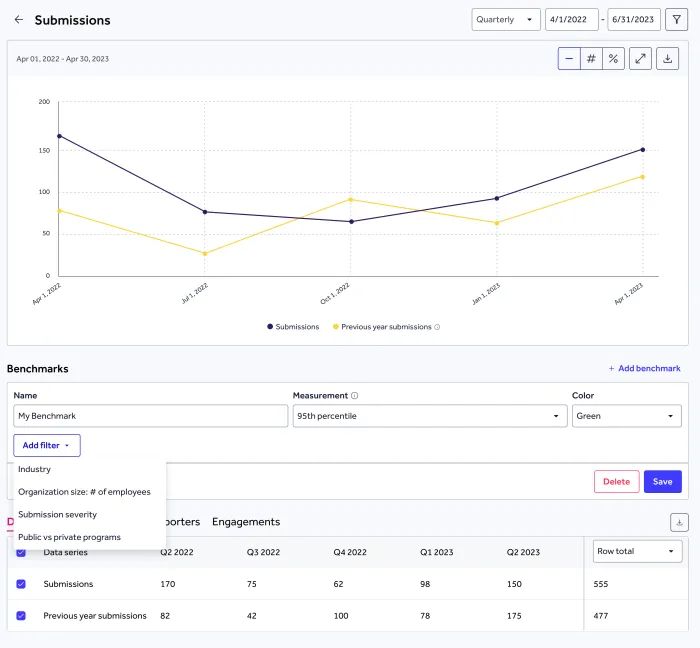
Benchmark and Improve Your Program
Track your bug bounty program against industry benchmarks and turn insights into next steps. See exactly where you stand, uncover new opportunities, and get tailored recommendations to keep improving.
- Benchmark payouts, response times, and results against industry peers with the Bounty Table Benchmarking Dashboard
- Compare your submission volume and engagement to programs across the platform
- Build custom benchmarks to track progress on your own terms
- Get targeted recommendations in-platform to strengthen performance and efficiency
The platform also makes it easy for our team to identify patterns in specific vulnerability classes that repeatedly affected us. Server-Side Request Forgery (SSRF) issues used to be prolific throughout the application, averaging 13 reports per year before 2020. Since then, we've made security enhancements to the product and have only received three SSRF reports.
When I look at my board metrics, the main metric I convey to the board about the health of my bug bounty program is the number of unique researchers that have reported at least one vulnerability in a given quarter. The program is only as good as the engagement from researchers, and researchers can spend their time on any program.


Each report tells a story. These stories tell worst-case scenarios that we avoided because a security researcher provided a report. Telling these stories to leadership is an excellent opportunity to demonstrate the value of the bug bounty program and security researchers, which enables us to continue expanding our program
The key upsides of using HackerOne are the broad vulnerability coverage and the in-depth metrics that help us demonstrate program impact and effectiness. The support from HackerOne’s team makes the ongoing management of our program are seamless.


Frequently asked questions
The RoM Dashboard bridges the gap between technical execution and business value, giving each audience a clear view of program performance:
- CISOs and Security Executives: Justify budgets and demonstrate program impact year over year. Highlight the RoM multiplier as a measure of cost-efficiency, use mitigated losses to show risk reduction, and connect results to strategic initiatives and board reporting.
- Security Program Managers: Track and optimize HackerOne program performance by monitoring trends in mitigated losses and report resolution volume. Identify which assets or asset groups drive the most risk reduction, and refine inputs for more accurate and defensible RoM metrics.
- CFOs and Business Leaders: Understand the financial return of security investments by focusing on the ratio of investment to mitigated loss (RoM multiplier). Present security as a cost-avoidance engine rather than a cost center, with exportable visuals aligned to financial reporting.
RoM provides quantifiable evidence of proactive risk reduction that supports both:
- Compliance: Exportable PDF reports, including worst-case mitigation estimates, can strengthen audit documentation, regulatory submissions, and internal risk assessments.
- Cyber insurance: RoM helps demonstrate reduced exposure, ongoing investment in security, and mitigation of high-impact vulnerabilities, which can be valuable during cyber insurance underwriting, renewals, or premium negotiations.
The Executive Dashboard is designed for security leaders and stakeholders who need to understand, communicate, and act on program performance without manual reporting:
- CISOs and Security Executives: Present year-over-year trends in vulnerabilities remediated, MTTR, and hacker engagement to boards and CFOs, highlighting measurable progress and supporting budget discussions.
- Security Program Managers: Monitor activity across Bug Bounty, Pentest, VDP, and Challenge programs. Drill into submission types, severities, and trends to identify where improvements or additional focus are needed.
- Compliance and GRC Leaders: Access audit-ready visuals and benchmarks to demonstrate SLA adherence, remediation discipline, and industry-aligned performance for regulatory and internal reviews.
The dashboard simplifies compliance documentation by offering:
- YoY MTTR and severity trends to demonstrate SLA adherence and remediation discipline.
- Benchmark comparisons to show your organization’s performance is in line with or exceeding industry standards.
- Exportable PDF and slide-ready formats for regulatory reviews, audits, and internal reporting.
Benchmarks are built using HackerOne’s dataset of 500,000+ vulnerabilities across 3,500+ customer programs. Metrics are segmented by factors like industry, company size, program type, and asset category to create meaningful comparisons. These benchmarks are updated regularly to reflect the most current customer data.
All dashboard visuals and summaries can be exported as PDFs, image files, or slide-ready assets for easy inclusion in board decks, quarterly business reviews, and compliance documentation.