See Your Success In Real Time with the new Program Dashboard

We’ve revamped the Program Dashboard to help you better understand the value that hacker-powered security is bringing to your company. We started the journey of improving our reporting and analytics, and today we’re releasing the first version of our upgraded Program Dashboard. This isn’t the final version, but rather the start of a new chapter for reporting and analytics.
The newly revised dashboard provides more granular data to show you how your program is performing. We’ve completely overhauled the dashboard and added a number of new features to better support your needs.
We’ve restructured how the dashboard is presented. Instead of showing all statistics on one page, we’ve split it into multiple pages to keep things organized. You can now view the metrics on these pages:
- Submissions
- Statistics
- Response Efficiency
- Feedback (private programs only)
New asset and program filters
We’ve implemented a new date picker that enables you to choose from more interval options. You can also filter your data based on a specific asset so that you can drill deep into specific metrics per asset.
If you run multiple programs, the dashboard now allows seeing aggregated views of all programs with the new programs filter, which enables you to see all your program statistics in one unified view.
New charts and tables
The new Program Dashboard features a number of new sets of data charts and tables. As bounties are an important metric for a lot of customers, all our graphs and tables can now show metrics in both valid reports and bounties paid.
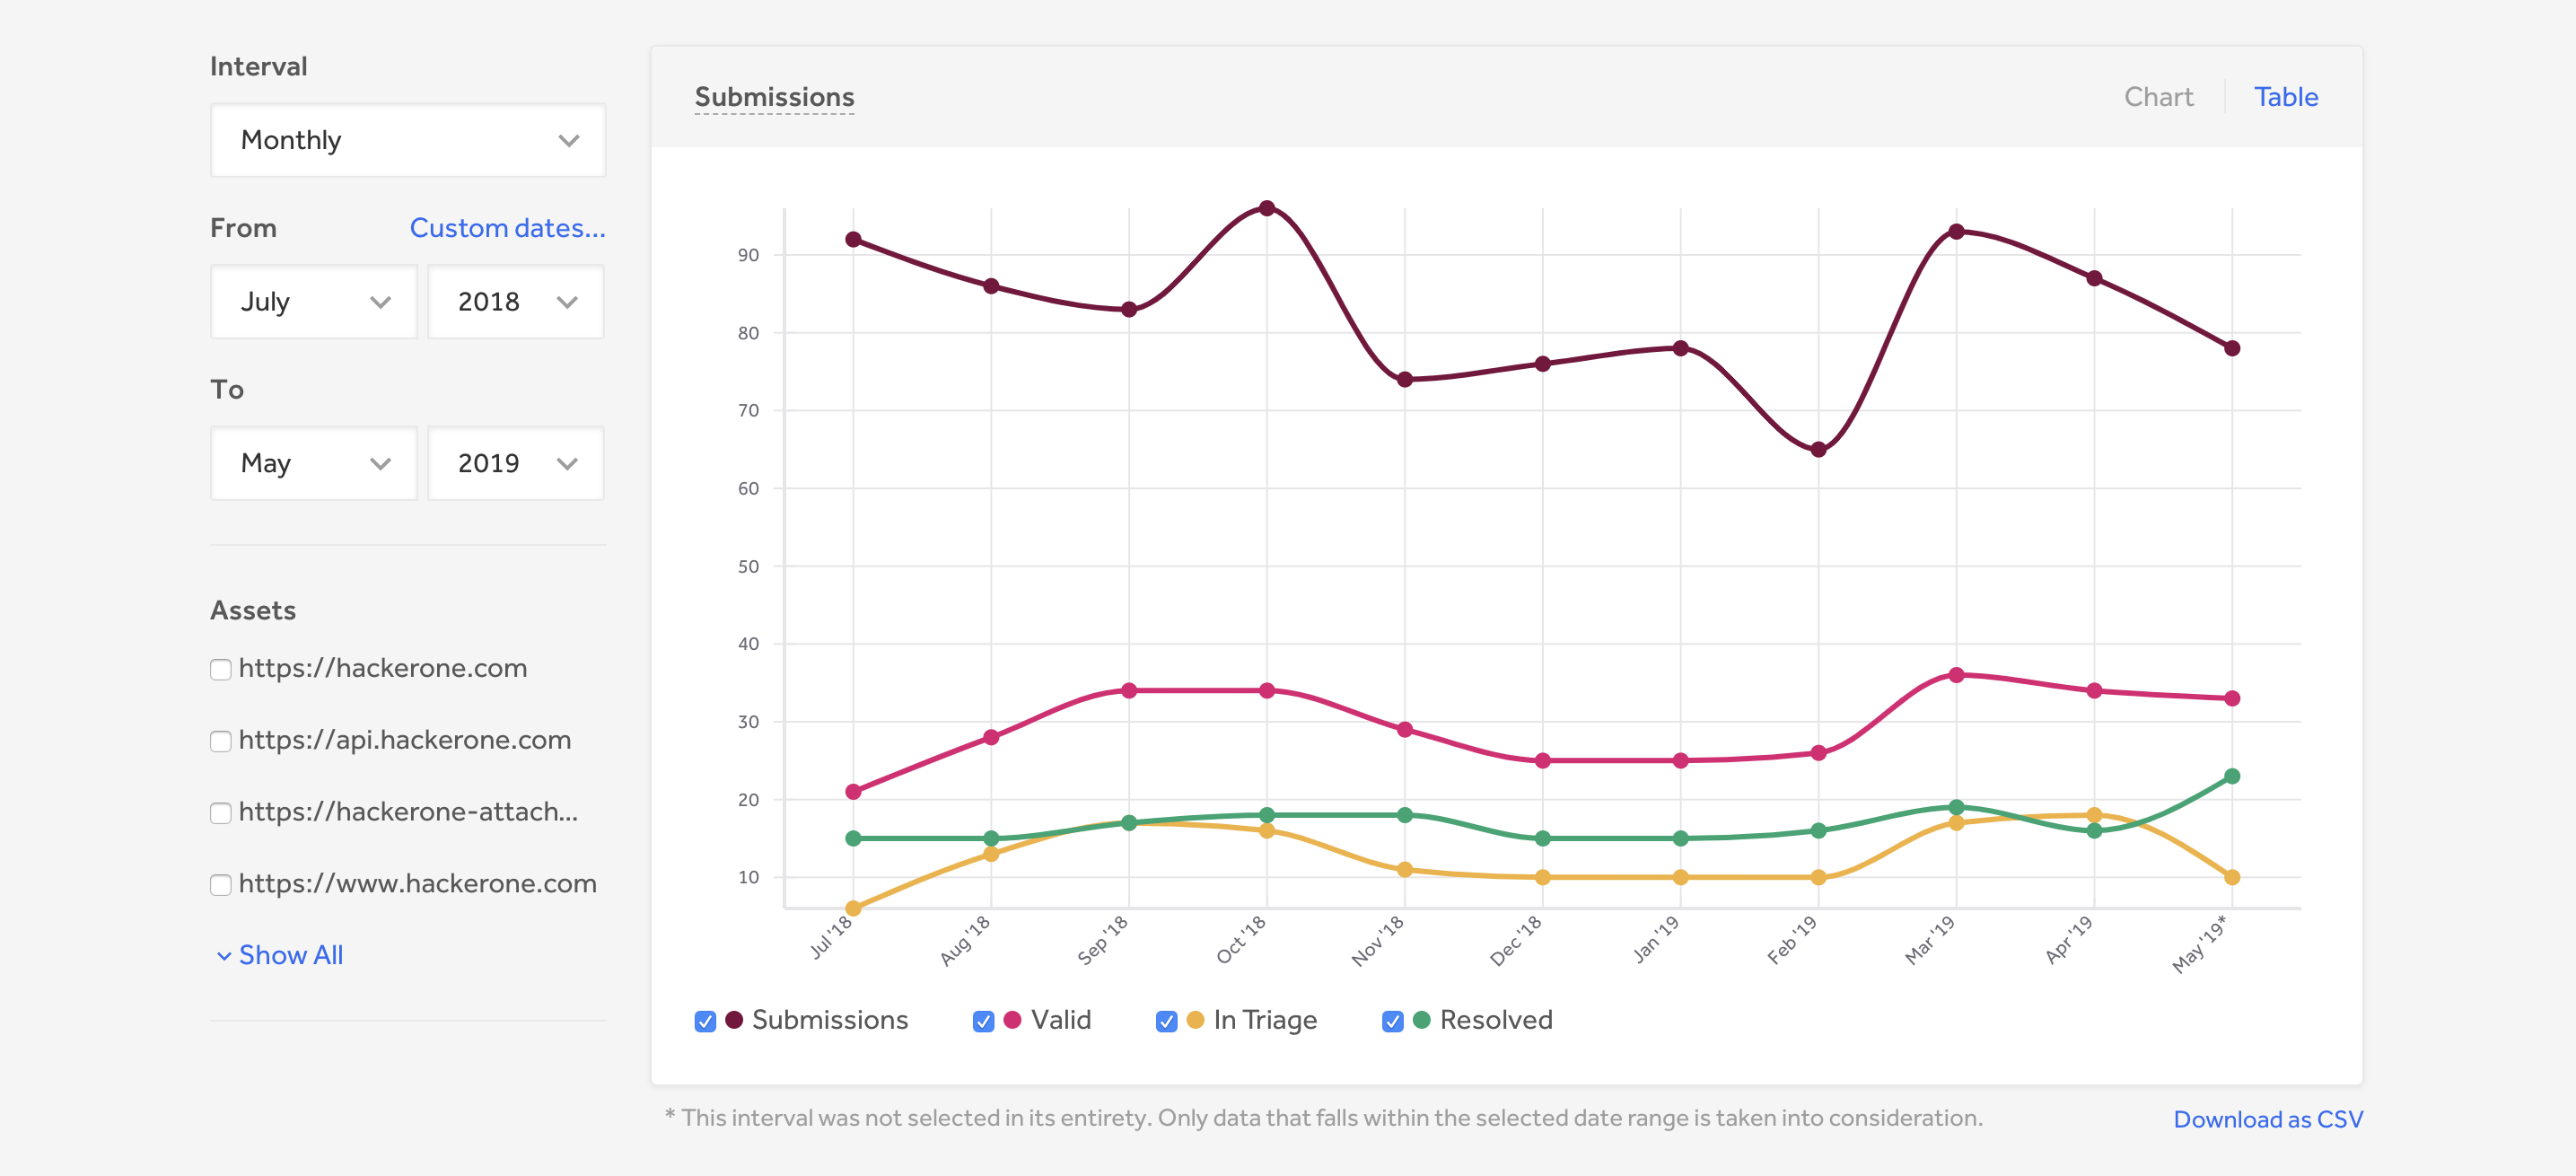
Submission metrics
The Submissions section contains a number of new metrics that give you a quick overview of your report submission metrics. You can view report submission trends, the number of valid reports and the number of reports in triage.
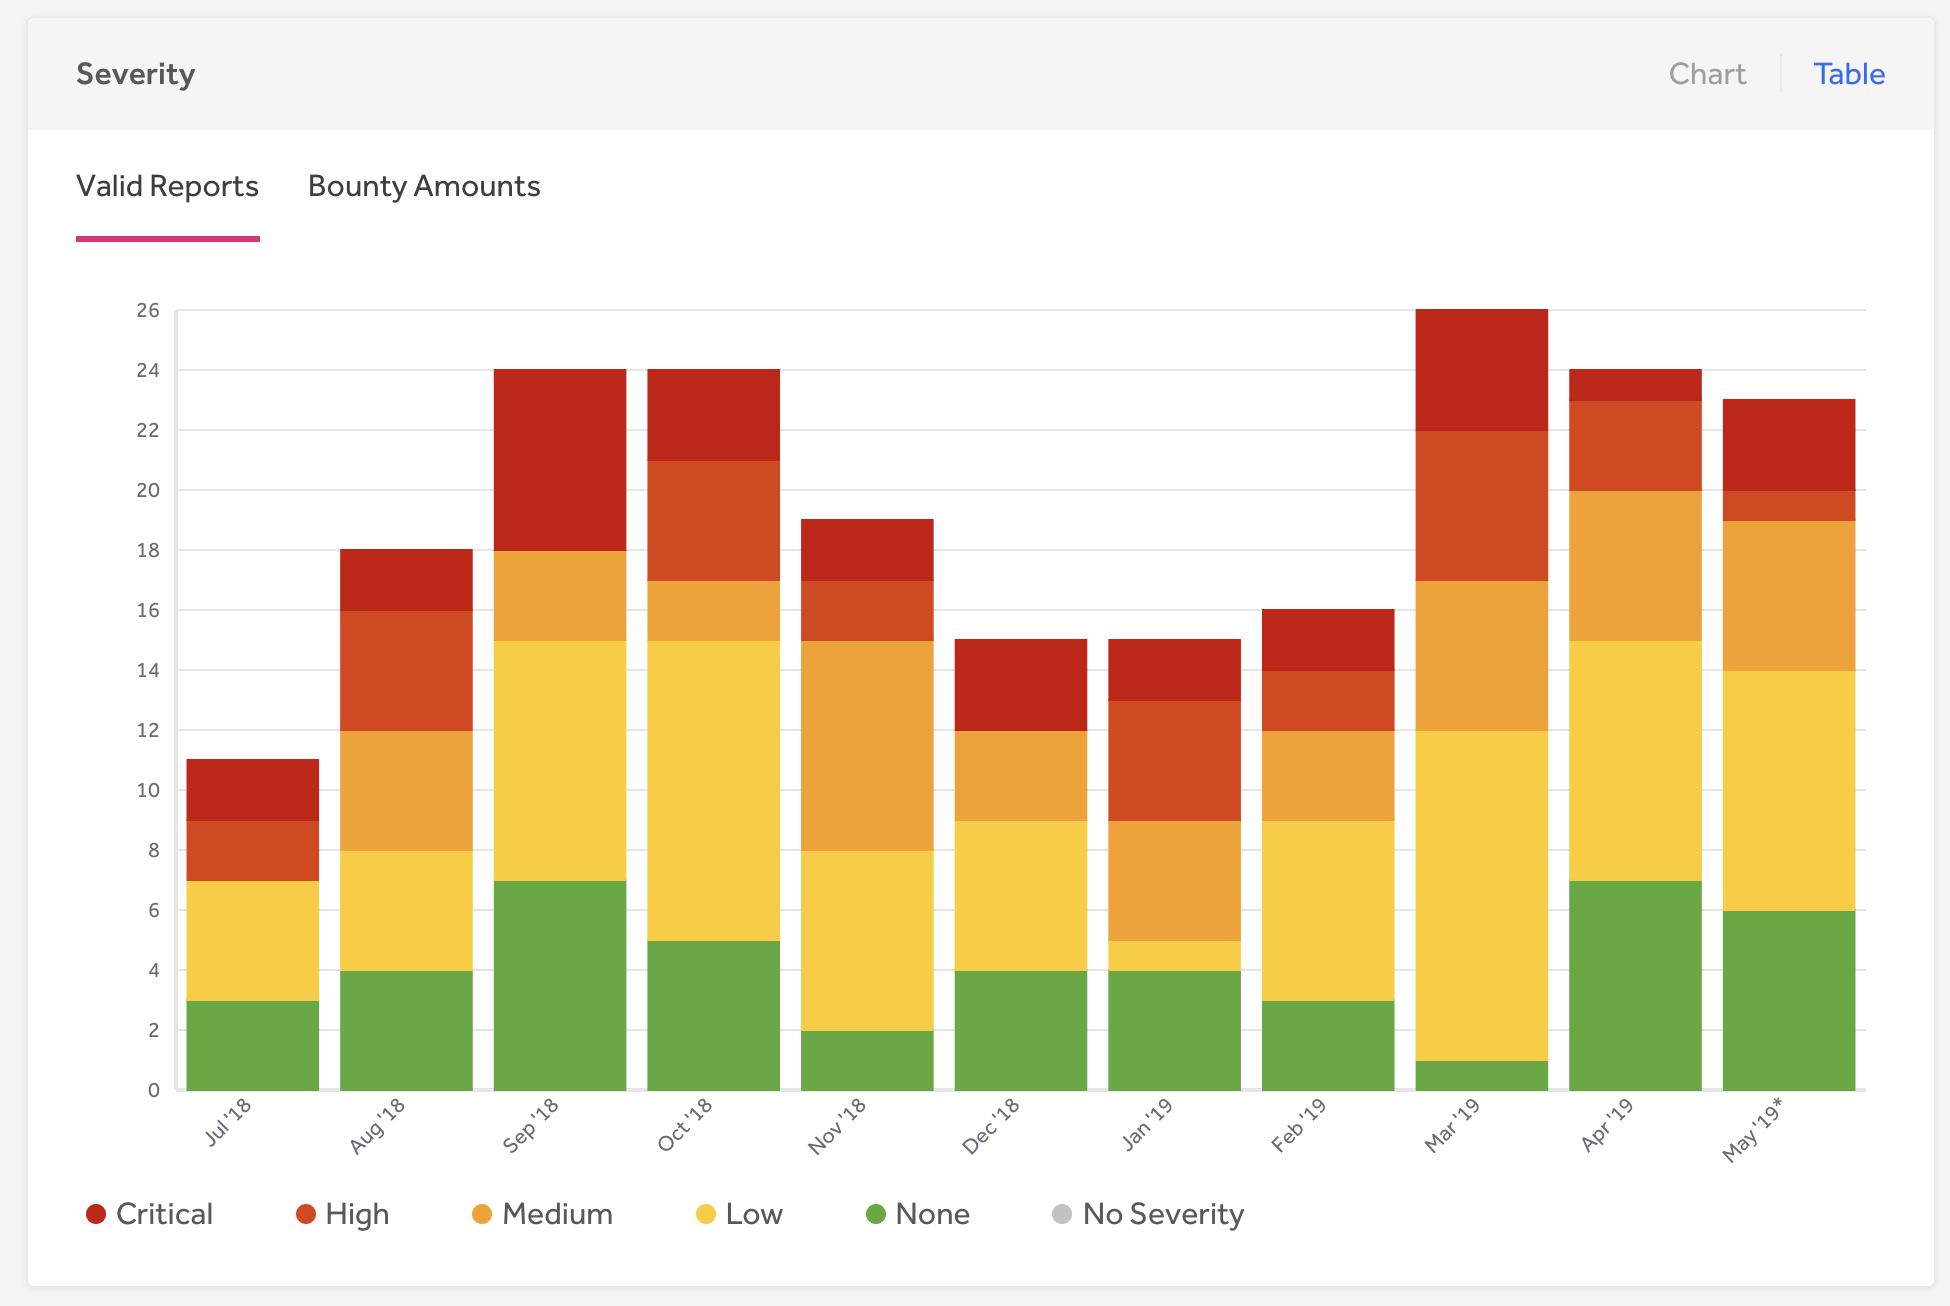
Reports by severity
The new Severity section shows how reports and bounties are distributed by severity. This enables you to view trends on how many valid reports are submitted and paid per severity.
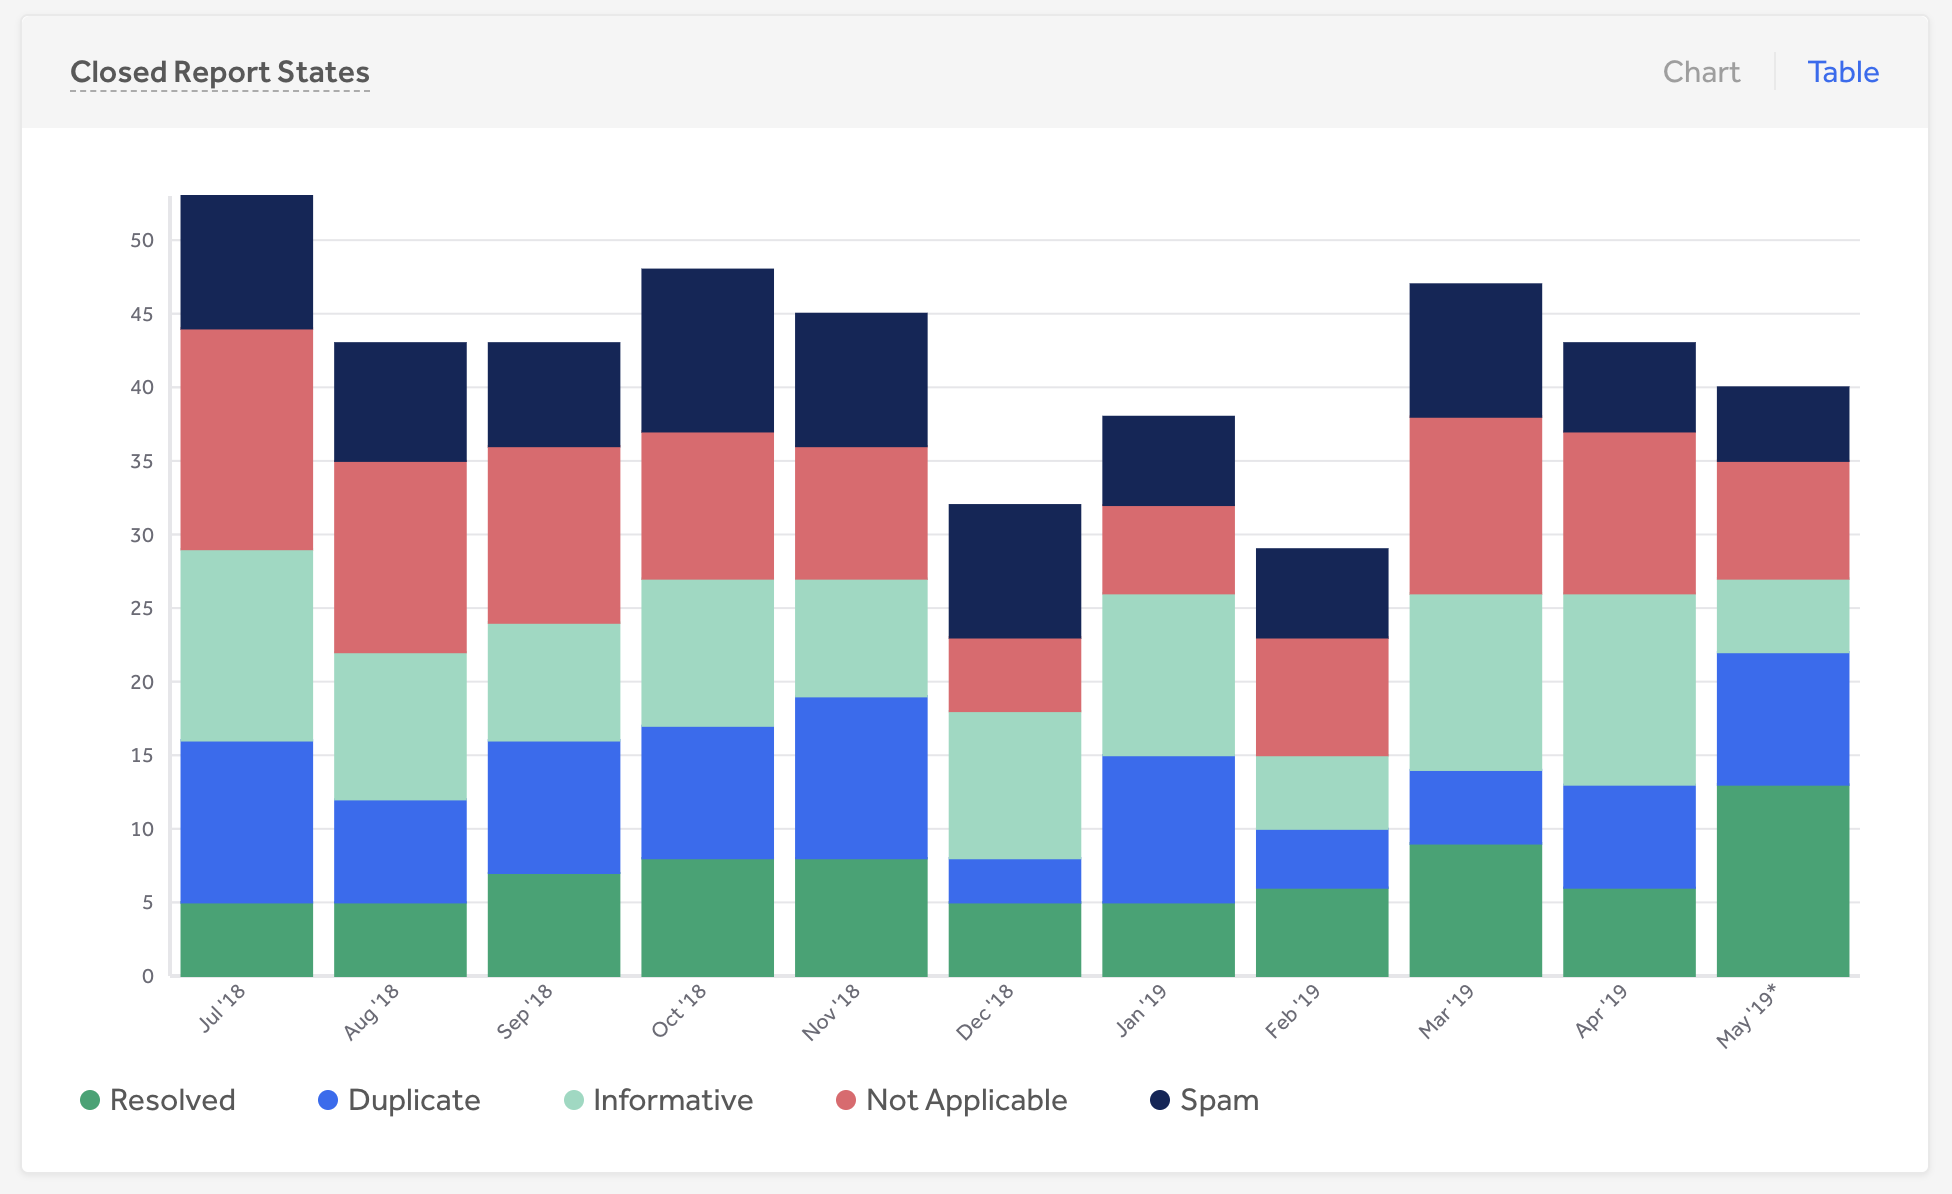
Closed report states
The Closed Report States section shows how your reports are distributed among the various closed states a report can have.
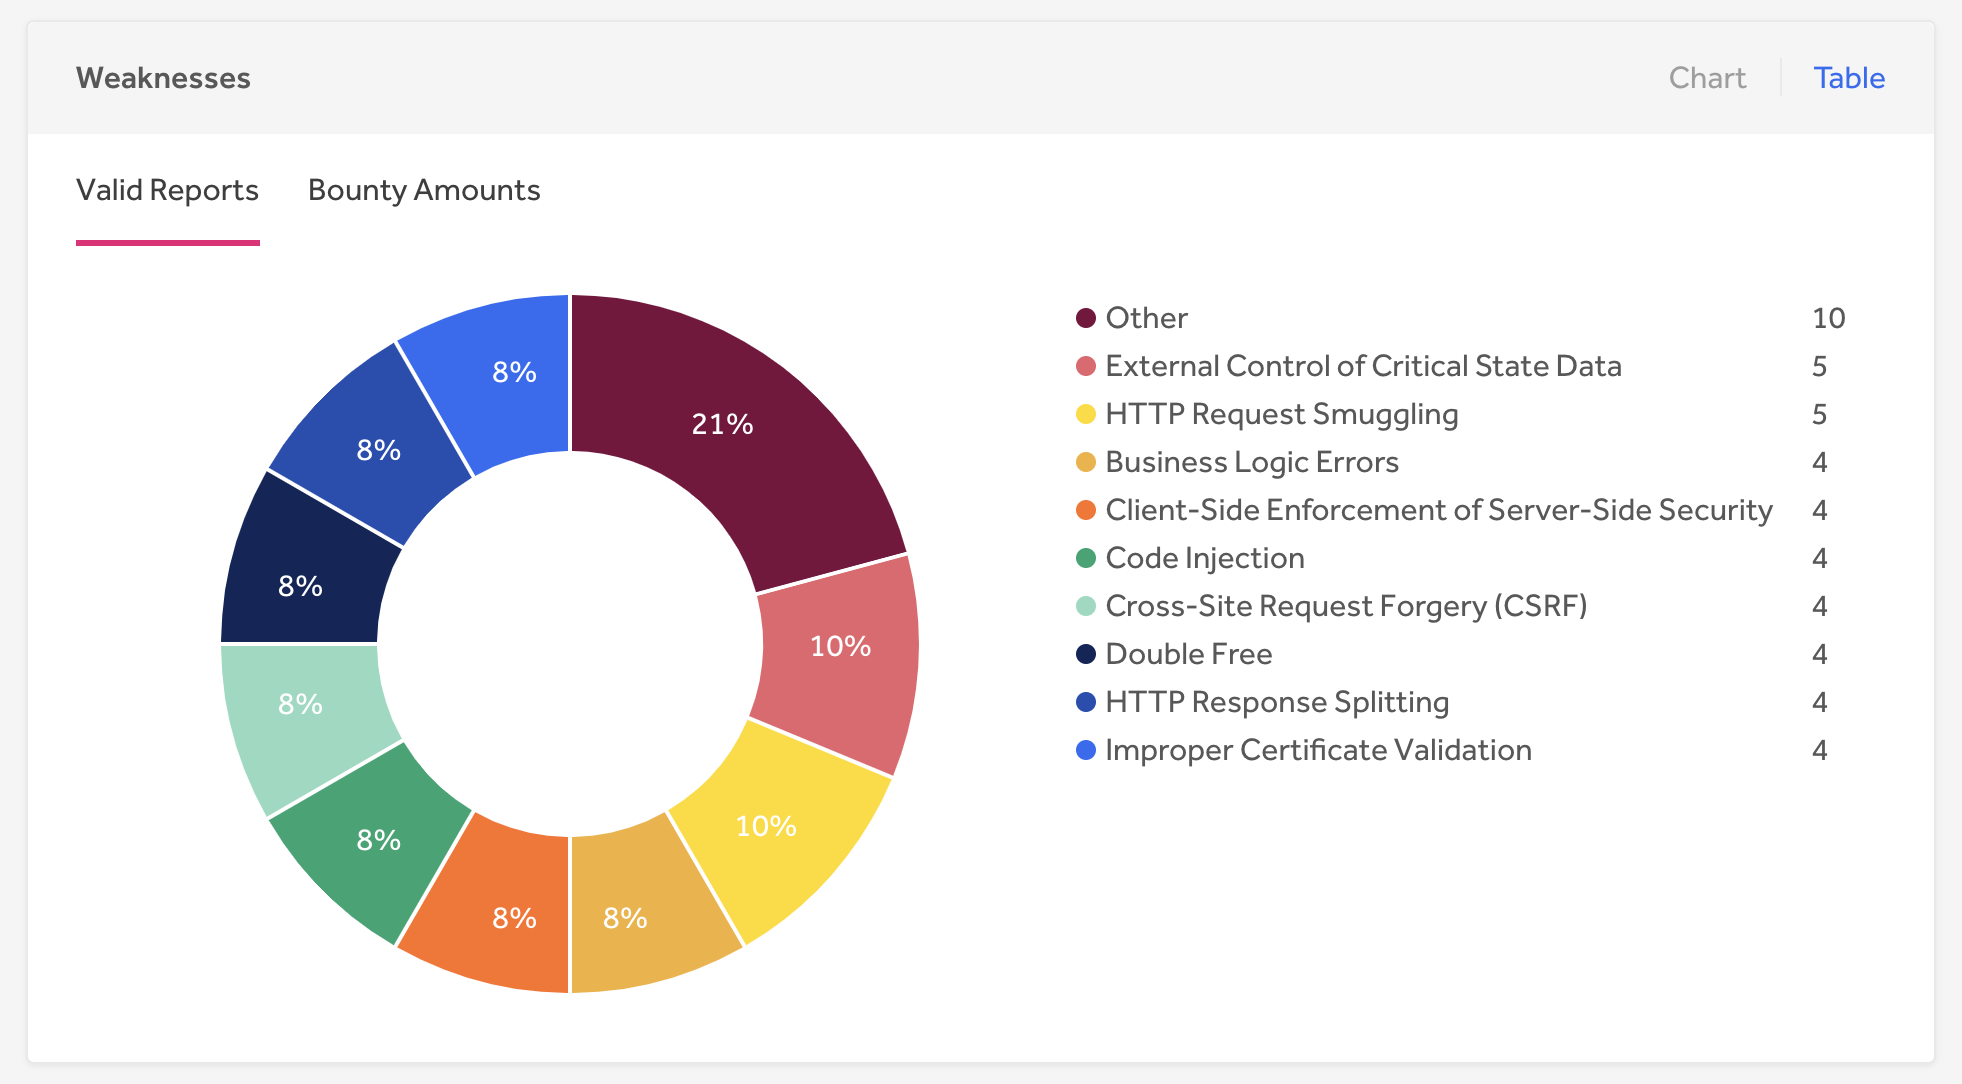
Reports by weakness
We’ve received the most requests to have the ability to see how reports are spread among the different weaknesses. With the new Weaknesses section, you can now see what areas you’re receiving the most valid vulnerabilities in so that you can know which vulnerabilities your program is most susceptible to.
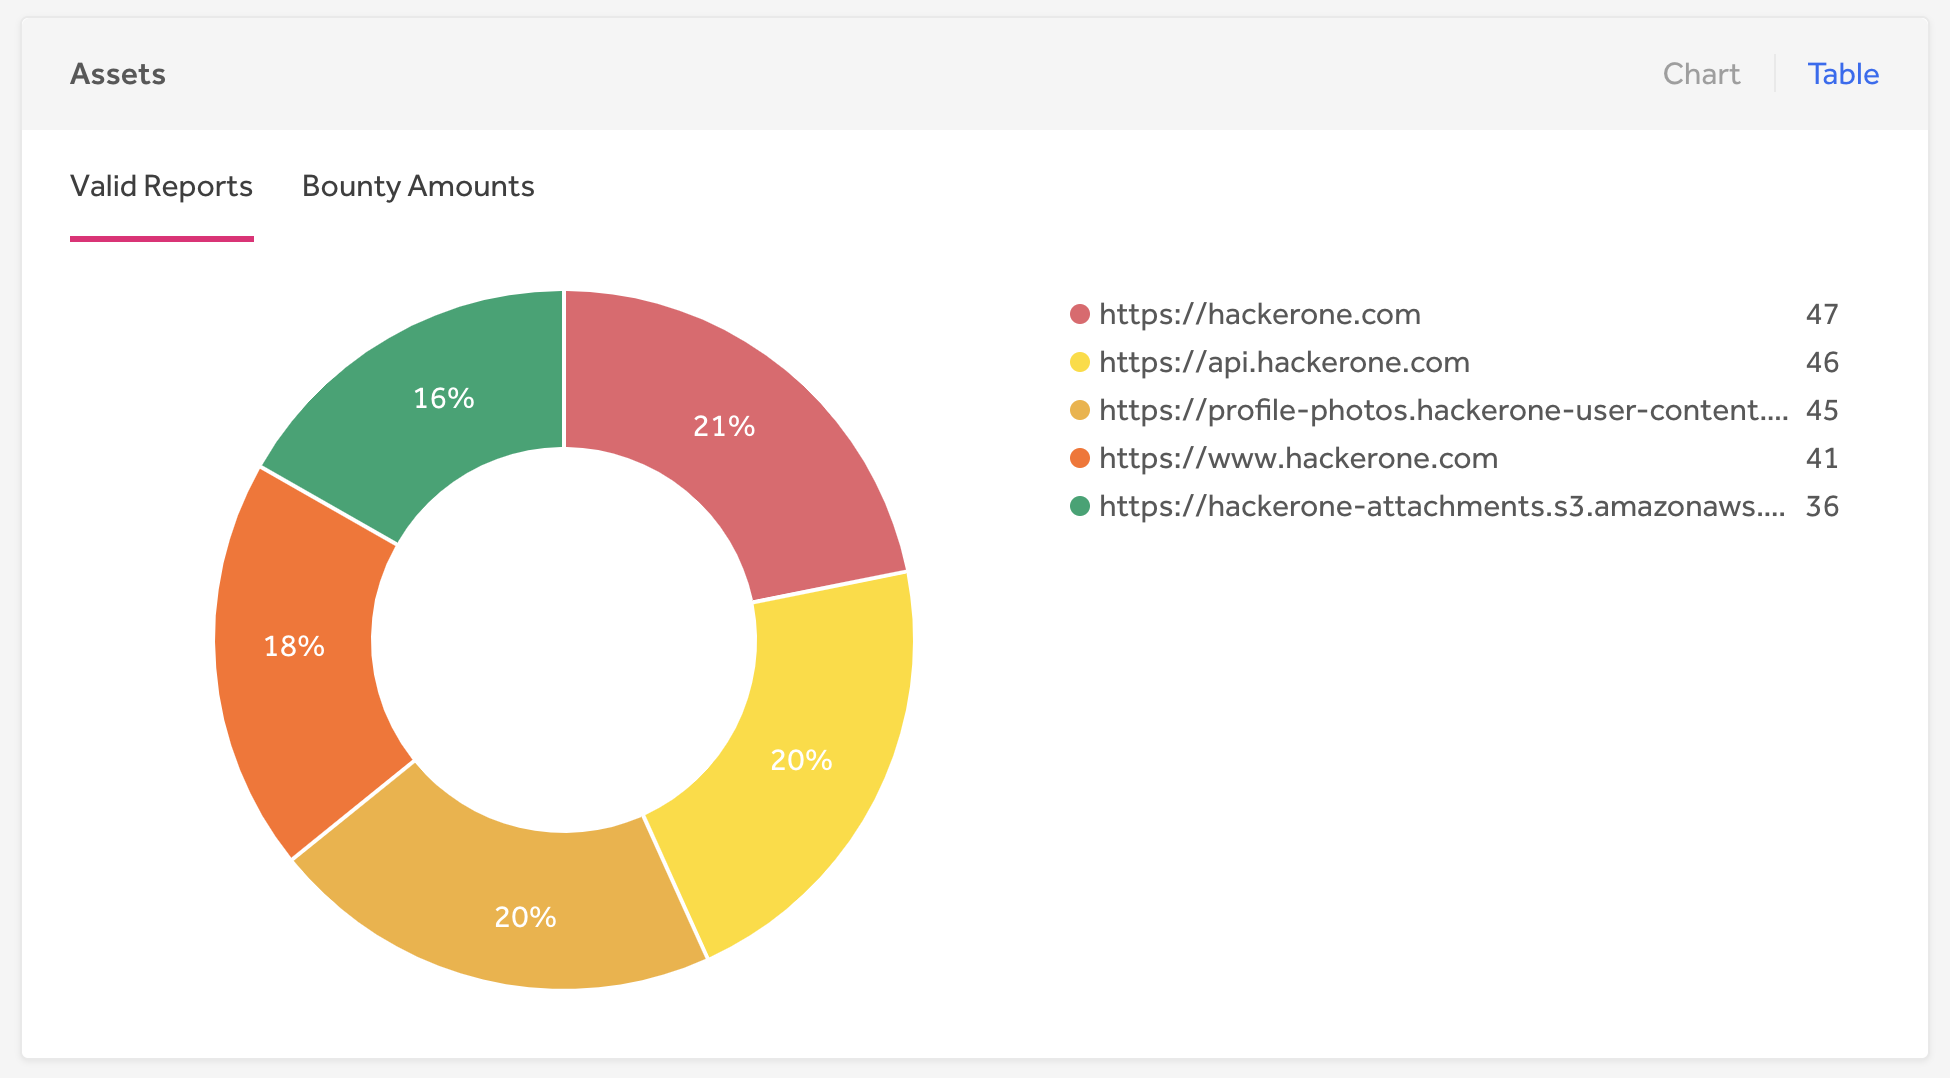
Reports by asset
The Assets section enables you to explore reports and bounties by asset. You can see which asset you’re receiving the most vulnerabilities in and how much bounty is paid out per asset.
The dashboard also features various exporting options. You can export all data at once to a CSV or PDF file. You can also choose to download data per section if you’re only interested in specific datasets. For more information on all functionality the Program Dashboard has, please visit our docs.
As said, this is just the beginning. We will continue building new features on top of the Program Dashboard. Please let us know what you would like to see to support your reporting and analytics needs.
About the Author