Turning Risk Reduction into a Living Metric: The RoM Dashboard is Here

Security leaders face a constant challenge: how do you prove the value of your cybersecurity program in the language of the boardroom? Traditional ROI falls short: security doesn’t create profit, it protects it by preventing breaches, building trust, and maintaining operational continuity.
Earlier this year, we introduced Return on Mitigation (RoM) as a framework to bridge that gap. The white paper and Hai-powered calculator sparked widespread interest with the countless security leaders we interviewed, but they wanted more: they asked for a way to make RoM real-time, automated, and built for leadership conversations.
Fast-forward to today, the new RoM Dashboard delivers exactly that. It transforms RoM from a static equation into a dynamic, exportable, fully configurable platform tool, designed so every customer can make the model their own.

"Where I'm having difficulty is with finance people who are not familiar with the reporting of vulnerabilities or the cost of breach assumptions. Trying to speak their language and help them understand the reliability and confidence in that reporting is certainly driving the trust in those conversations.
RoM gives business-minded folks a way to say: ‘Okay, this HackerOne program is not just a budget expense. You are actually saving our business money instead of just costing us money.’"
— Senior Manager, Global Threat Intelligence at a leading global media and entertainment company
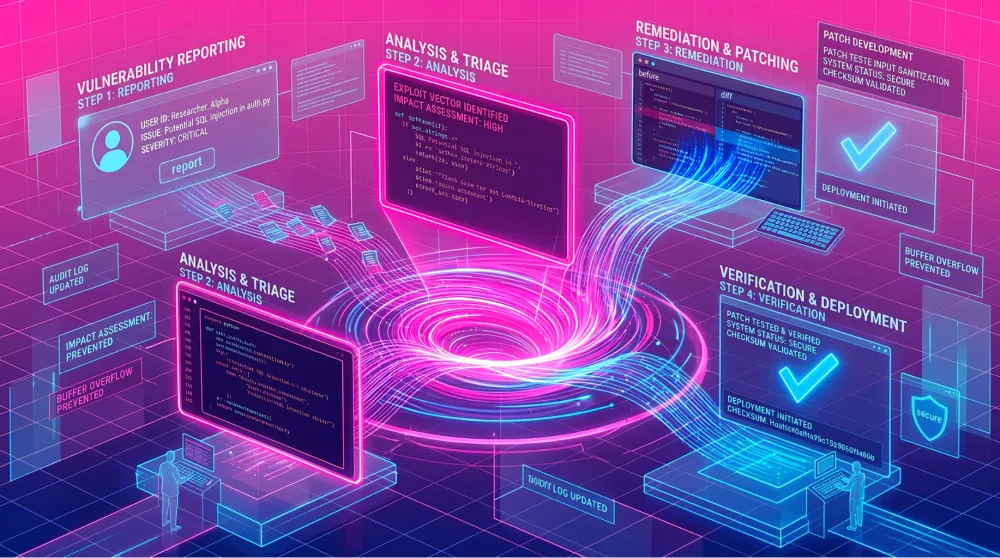
How the RoM Dashboard works
The RoM Dashboard is powered by a bottom-up, risk-centric methodology, embedded directly into the HackerOne platform. The model aggregates investment and return values from the vulnerability level, considering both the likelihood of exploitation (Annual Rate of Occurrence, ARO) and the financial impact (Single Loss Expectancy, SLE) of each resolved issue.
While the formula is straightforward, the dashboard layers in program-derived data, benchmark-driven risk modeling, configurable parameters, and automatic recalculation so security leaders can focus on insights, not spreadsheets.
Available under Analytics in the HackerOne platform, the dashboard delivers exportable, configurable views designed for board decks, QBRs, compliance reporting, and ongoing program reviews.
Here’s a quick look at its core capabilities:
RoM multiplier and mitigated losses
Instantly view your organization’s RoM score, showing exactly how many dollars in risk you’ve eliminated for every $1 invested, and your total mitigated losses to date.

“Return on Mitigation’s (RoM) data-driven approach allows us to demonstrate the real impact of proactive mitigation to the board, ensuring our security investments not only protect the bottom line but also strengthen customer trust,”
– Rossini Moraes, Information Security Manager at Inter&Co.
Investment vs. losses mitigated with benchmarking
One of the most requested features from customers, this view lets you see how your RoM stacks up. Compare your program’s total investment against avoided losses, and benchmark your RoM performance directly against similar HackerOne customers to answer the question every leader asks: “How does my RoM compare to others?”

Top risks and vulnerabilities driving value
Identify which CWE weaknesses, reports, and assets have delivered the greatest financial impact so you can focus on the areas with the highest return.

Breakdown of mitigated losses by CIA impact
Understand where your risk reduction is delivering the most value, with financial breakdowns across confidentiality, integrity, and availability categories, which come from report-level impact ratings.

Highest-Impact Reports, Simplified
Identify the reports that delivered the greatest risk reduction, ranked by estimated losses avoided. Jump directly into each report or ask Hai for plain-language summaries and deeper insight into why these findings mattered most.

Why customization matters
The RoM Dashboard is preloaded with industry baselines from trusted sources like IBM’s Cost of a Data Breach Report and the Verizon DBIR, but every organization has its own risk model. The most meaningful RoM insights come when customers tailor the defaults:
- Override SLE (Single Loss Expectancy) and ARO (Annual Rate of Occurrence) at the organization, asset, or grouped asset level.
- Adjust CIA (confidentiality, integrity, availability) impact sliders to reflect your actual report-level impact ratings.
- Update revenue and industry values so the breach cost models reflect your business reality, not a generic average.
These inputs not only make your RoM scores more accurate but also help us continuously tune our defaults so they reflect how customers truly measure risk.

Hai: Making RoM Insights Actionable
While the dashboard delivers the metrics, Hai brings them to life.
Hai can still interpret RoM results in plain language, answer questions like “Which vulnerabilities drove the most avoided loss this quarter?”, and automate scheduled RoM summaries so executives and program leaders always have up-to-date, exportable insights– weekly, monthly, or quarterly.

Start measuring your program’s impact
The RoM Dashboard is now live for all HackerOne customers. To learn more about how it works, visit the Docs page.
Log in to your dashboard to see your RoM score, track year-over-year performance, and benchmark against similar programs. Or book a session with your HackerOne team to review your results, understand how your program compares, and identify where to focus your next investments.
About the Authors